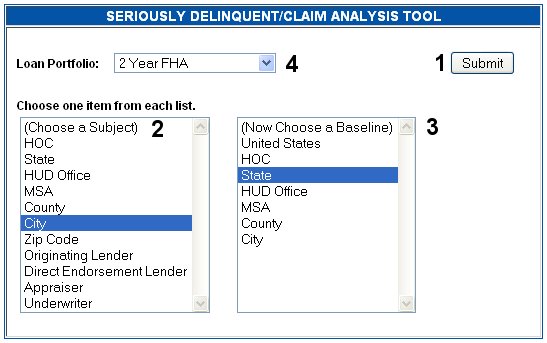
Neighborhood Watch/Early Warning System Help

Analysis - Seriously Delinquent/Claim Comparison

Comparison Selection Screen
Screenshot of analysis selection page
1. Submit button
Click this button after you have selected items from both lists to proceed to the next screen.
2. Subject List
Click on one item in the left list to select your subject area or lender. The key difference between this list and the baseline list on the right side of the box is in the way the "Compare Ratio" is calculated. The compare ratio is computed by dividing, for example, the delinquent percentage of the subject area/lender by the delinquent percentage of the baseline area/lender. Therefore, the subject area/lender should always be the smaller of the two, so that compare ratios are greater than one for unusually high percentages, and less than one for lower than normal percentages.
3. Baseline list
Click on one item in the right list to select the area or lender against which your subject area/lender will be compared. Generally, the item selected here will be an area surrounding the subject area/lender. For example, if the subject area is a ZIP Code in Chicago, the baseline area might be the city of Chicago, the MSA of Chicago, or the State of Illinois.
4. Type of Loan Portfolio
Select which type of loan portfolio for which you wish to filter the Early Warnings data.

Selection Screen for Subject of Comparison
Screenshot of analysis selection page
1. Subject selection
The label here indicates the type of area (or lender) selected on the left list in the previous screen. Click on the arrow on the right of the list box to select what will serve as the subject for the analysis. In the example shown, city was chosen as the subject. First you must indicate the State in which the city is located by selecting the appropriate one from the list box and then clicking Submit.
2. Baseline selection
The label here indicates the type of area (or lender) selected on the right list of the previous screen. This part of the selection screen is not activated until the subject selection is completed.
3. Submit button
Click this button after you have selected a State.

Selection Screen for Baseline for Comparison
Screenshot of analysis selection page
1. Subject selection
The subject selection has been completed, as indicated.
2. Baseline selection
You may now choose a State to which the city will be compared.
3. Submit button
Click this button after you have selected a State.

Output Options Selection Screen for Comparison
Screenshot of analysis selection page
1. What is Being Compared
This area restates what is being compared.
2. Analysis Type
Check one of the radio buttons in this area to indicate the type of analysis you want performed. The three types that are currently available include:
  • Delinquent Choice - Percent of Originations Seriously Delinquent
  • Delinquent Choice - Percent of Originations Seriously Delinquent Within First Year
  • Loan Volume - Total Originations during a specific timeframe (last three calendar years plus current year to date as of the most recent refresh)
3. Performance Period
Choose the performance period for your Analysis report. Additional performance periods are available for baseline areas down to MSA level, and for the specific subjects of HUD Office, Originating Lender, and Direct Endorsement Lender.
4. Output Options
Currently, the only option available here is the "Sort By" option. This allows the user to sort the data by any column displayed in the result table. Simply choose the sort column, and select "ascending" or "descending," and then click submit. The "Output Type" option, which is not yet functioning, will in the future enable the user to show charts and graphs as well as data output.
5. Submit
Click this button when you are ready to display the output report.

Records Output Screen for Comparison
Screenshot of analysis output page
1. Main Report Title and Subtitle
The title indicates what primary data is being shown in the report. The subtitle indicates the delinquent period chosen in the previous option screen.
2. Data Table
Summary data and headings are displayed at the top, and detailed delinquent and origination data categorized by loan type/characteristics follow. Users can click on any column heading to link directly to an explanation of what the data is showing.
3. Report Summary
All output screens contain a report summary directly underneath the data table. This summary includes information that is necessary in order to properly interpret the report data. This report summary should always be attached to the report if it is printed on a separate page. Removing this page could result in misinterpretation of key data.


Neighborhood Watch footer image.  End of page.